
Consider an example of compiling a power transmission model using the phase coordinate method. In fig. 1 shows the power transmission, a mathematical model of which must be compiled. It is necessary to determine the currents in the short circuit mode at the beginning of the line.
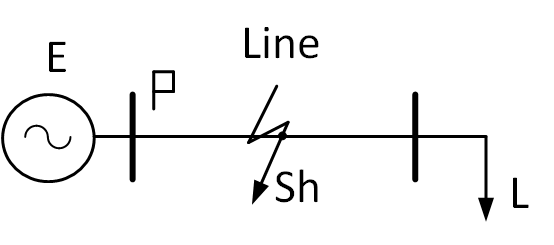
Fig. 1. Power transmission example
The following options are available for various power transmission elements:
- Power system (E) – EMF and resistance in a positive and zero sequence;
- Power line (Line) – line length, running resistance and conductivity;
- Load (L) – load power;
- Fault Model (Sh) – type of fault and transient resistance in the damaged phases.
In the phase coordinate method, the studied transmission will be presented in the form of a cascade connection of multipoles (Fig. 2). The figure also shows the sought currents and voltages.
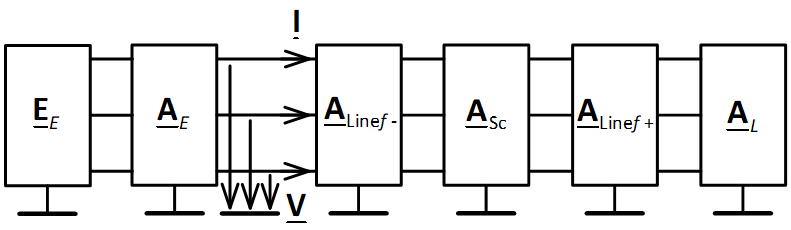
Fig. 2. The investigated transmission described in the basis of phase coordinates
In Matlab, matrix direct transmission of elements will be calculated using the following functions:

- for power system – function A_eqsys.m;
- for power transmission line – function A_line;
- for fault model – function A_fault.m;
- for load – function A_load.m.
To calculate currents and voltages at the beginning of a power line, it is necessary to compose an equivalent direct transmission matrix for the circuit:
A = AE ∙ ALinef– ∙ ASc ∙ ALinef+ ∙ AL.
The investigated circuit of Fig. 2 will be represented by an equivalent circuit (Fig. 3).
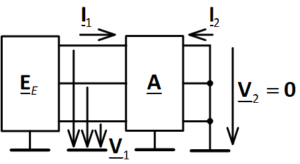
Fig. 3. Equivalent direct drive matrix circuit
In the calculation, the voltage of the power system EE is known. In addition, it is known that the voltage at the end of the power transmission behind the load is zero (since there is a grounded neutral). To calculate the currents at the beginning of a power transmission, it is necessary to recalculate the direct transfer matrix A into the form matrix Y using the A_to_Y.m function. As a result, the circuit of Fig. 3 can be represented in the form of a circuit with a conductivity matrix (Fig. 4).
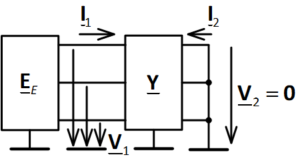
Fig. 4. Equivalent circuit with a conductivity matrix
From the diagram of Fig. 4 shows that  . From here you can calculate the currents:

где  .
.
By calculating the current I1, you can calculate the desired current and the desired voltage. To do this, consider in more detail Fig. 2. Let us designate the current obtained in the diagram (Fig. 5).
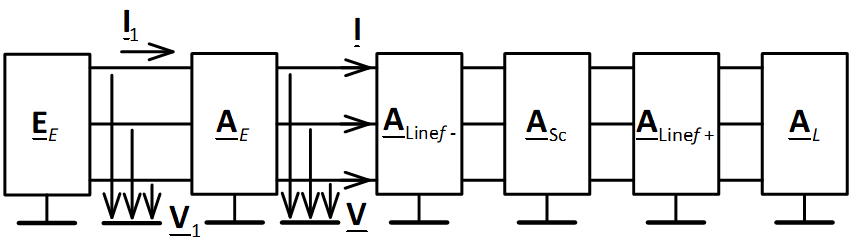
Fig. 5. The investigated power transmission described in the basis of phase coordinates
As already mentioned, the shape matrix A connects the currents and voltages at the input and output of the multipole in a certain ratio. For the circuit of Fig. 5
 .
.
Thus, in order to determine the desired quantities, it is necessary to solve this matrix equation. His decision is as follows
,
where ![]() is inverse matrix for the direct transmission matrix of the power system AE.
is inverse matrix for the direct transmission matrix of the power system AE.
The calculation presented in the note is given in the attached program file in the Matlab environment.