
For the Oscillogram Viewer in the COMTRADE format the functionality of constructing a vector diagram for analog channels has been added.
A new button ![]() is added to the toolbar, when you click on it, a vector diagram of the analog channels from the waveform is displayed on the right. When you click again, the vector diagram is hidden. Vector measurements of analog channels are displayed in the quantities in which they are presented in the waveform.
is added to the toolbar, when you click on it, a vector diagram of the analog channels from the waveform is displayed on the right. When you click again, the vector diagram is hidden. Vector measurements of analog channels are displayed in the quantities in which they are presented in the waveform.
By default, a vector diagram is built only for the first 3 analog channels (Fig. 1).
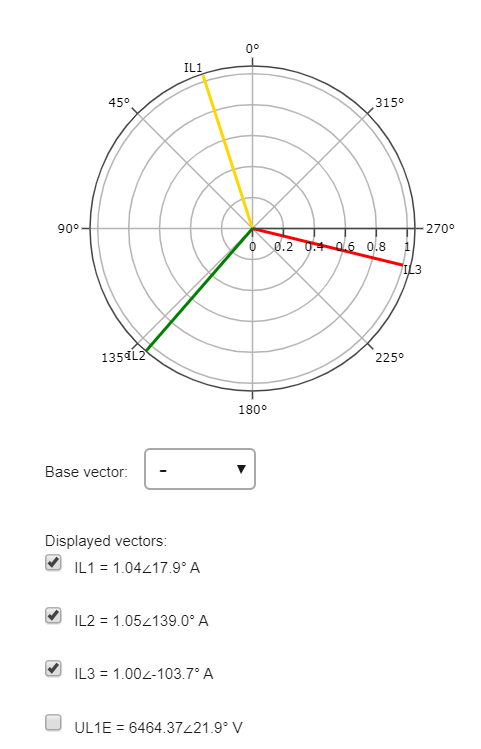
Fig. 1. The appearance of the vector diagram
If necessary, on the vector diagram, you can put all the other necessary analog channels. To do this, set the checkbox to the left of the required vector (Fig. 1). If some vectors need to be removed from the vector diagram, then in this case the checkbox must be removed.
The basic vector selection functionality is also available. When choosing a vector as a base one, its angle is taken equal to 0°, and all other vectors are drawn relative to it.

When the ruler moves along the waveform and when the display of analog values (in primary or secondary) changes, the vector diagram is redrawn for new values (Fig. 2).
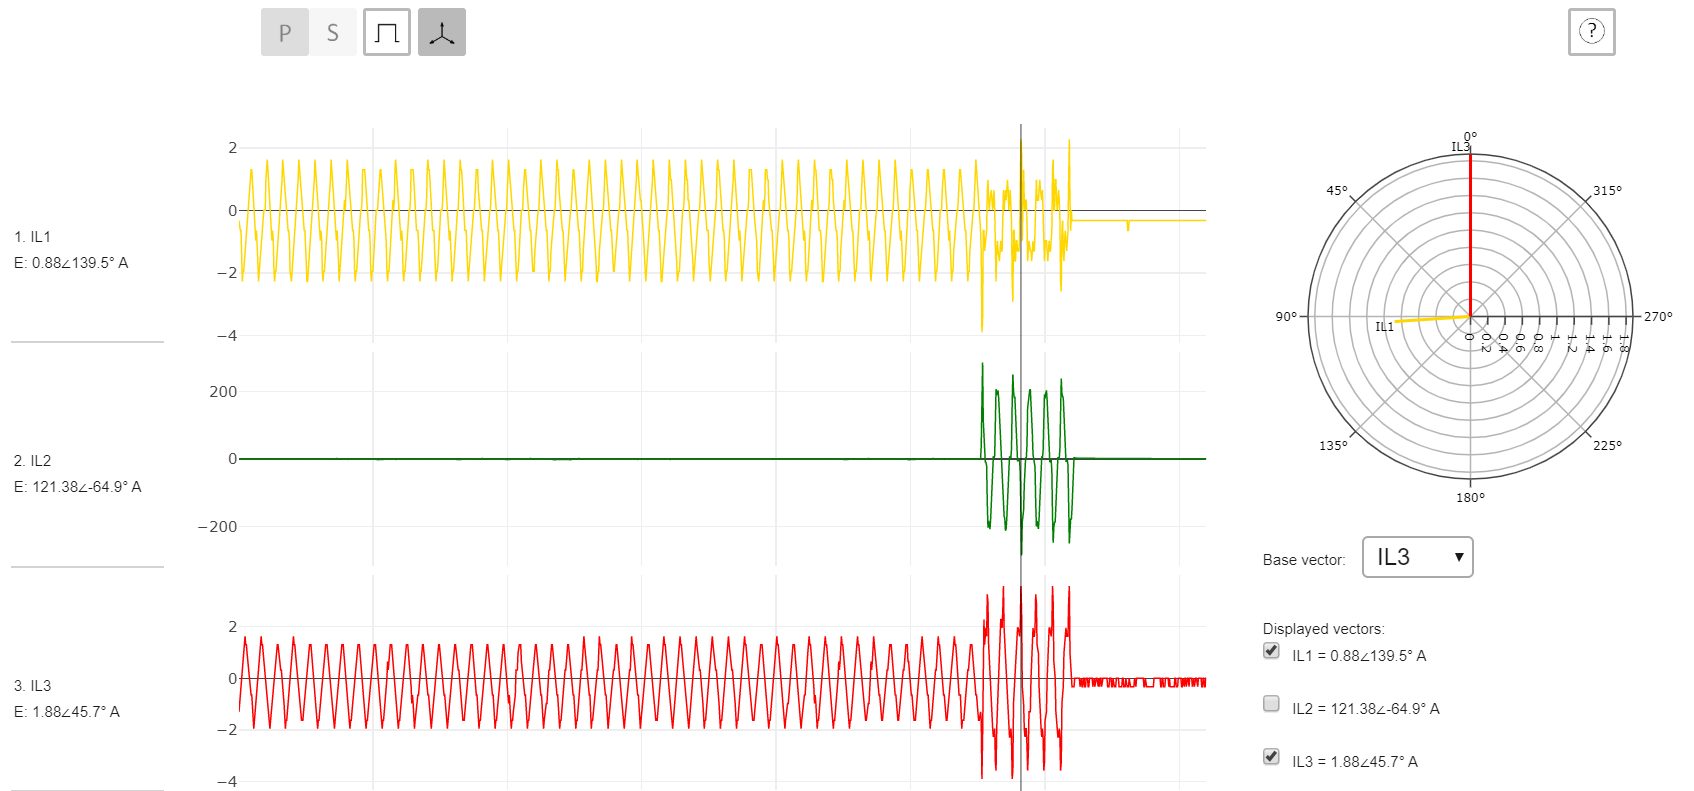
Fig. 2. The influence of the position of the ruler and the displayed values on the vector diagram
More detailed instructions for using the waveform viewer can be found here.