Model Signal Analysis
In order to simulate and analyze the operation of the Fourier filter, it is necessary to set the parameters of the simulating signals in the emergency and pre-emergency modes.
The pre-emergency mode is modeled by a sinusoidal signal, and the emergency mode is modeled by a sinusoidal signal and an exponent.
To simulate the pre-emergency mode, it is necessary to set its duration, module, initial phase and frequency of sinusoidal signal (Fig. 1).
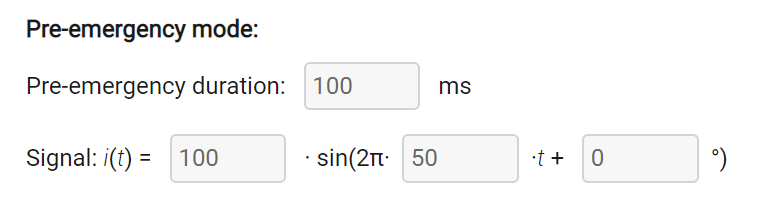
Fig. 1. Setting of the pre-emergency mode
To simulate the emergency mode, it is necessary to set its duration, module, initial phase and frequency of sinusoidal signal, as well as the attenuation coefficient of the exponent (Fig. 2). The exponent module is calculated automatically to ensure signal continuity.
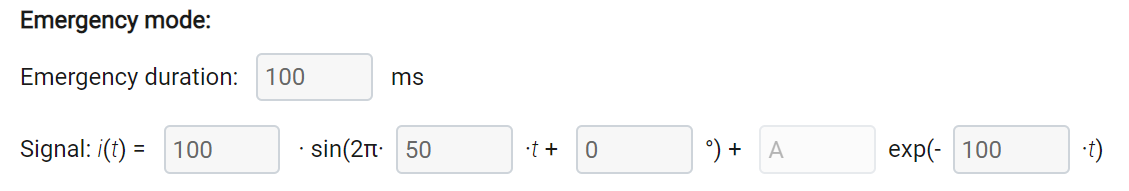
Fig. 2. Setting of the emergency mode
In addition, you must set the frequency at which the Fourier filter is configured, and the sampling frequency of the input signal (Fig. 3).
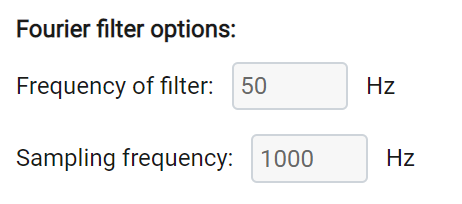
Fig. 3. Setting of the Fourier filter
After setting all the parameters, click the “Calculate” button, after which the output signal of the Fourier filter will be calculated. As a result, the program will form 2 graphics. The first graph displays the original signal and its amplitude value (Fig. 4). The second graph shows the phase of the original signal (Fig. 5).
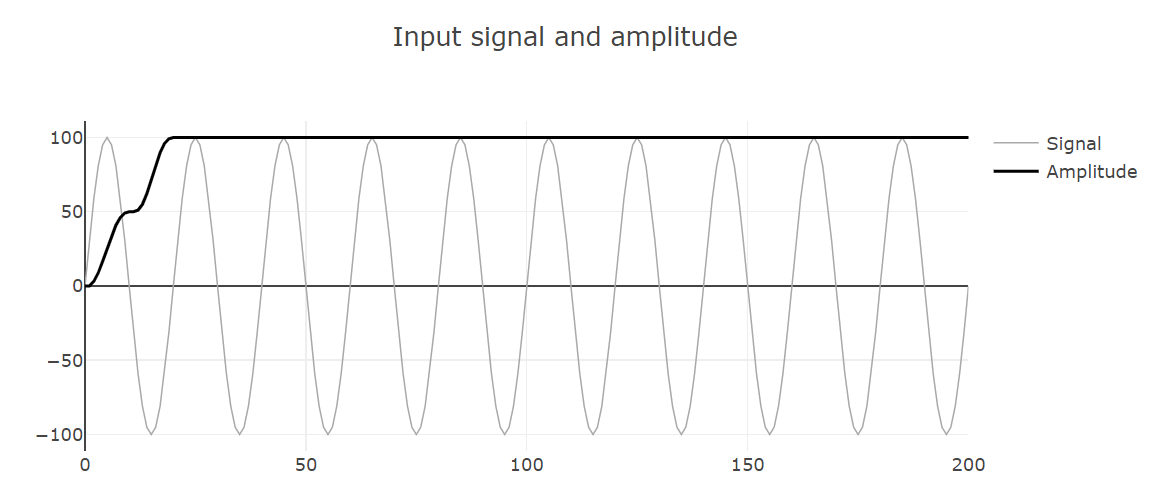
Fig. 4. The input signal and its amplitude value obtained after the Fourier filter
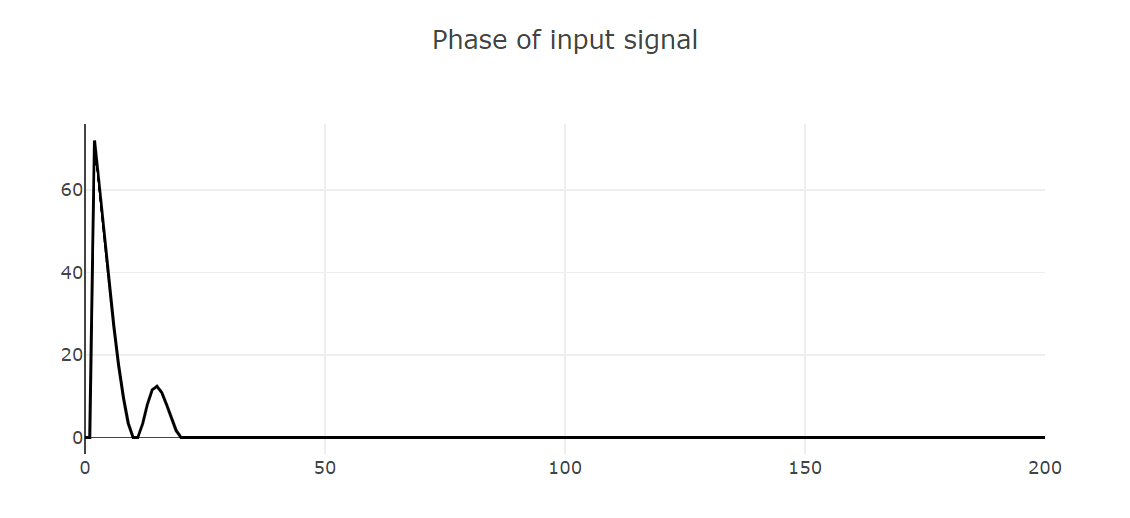
Fig. 5. The phase of the input signal obtained after the Fourier filter
Analysis signals from oscillogram
To analyze an any signal from an oscillogram with Fourier filter, select the signal source “Oscillogram” and press the “Select” button. Then you need to download 2 oscillogram files with the extension *.CFG and *.DAT recorded in the COMTRADE 1991 or COMTRADE 1999 format, and click the “Next” button.
Then you need to select the desired signal from the list generated automatically by the program from the CFG-file and set the network frequency. The signal sampling frequency will be determined automatically from the CFG-file (Fig. 6). Click the “Calculate” button.
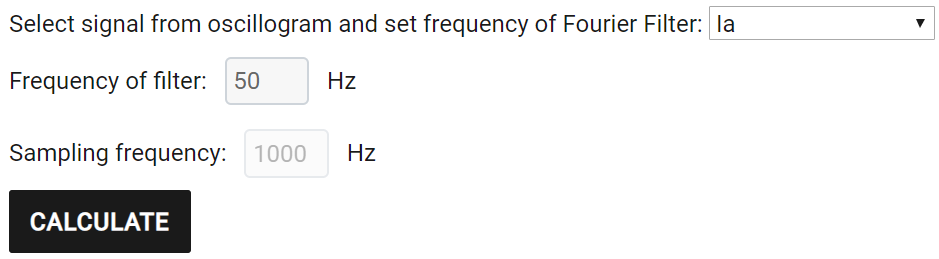
Fig. 6. Signal selection from the oscillogram
2 graphs will be displayed on the screen (Fig. 7), containing the results of calculating the output signal of the Fourier filter. The first graph displays the signal in question and its amplitude value. The second graph shows the phase of the original signal.
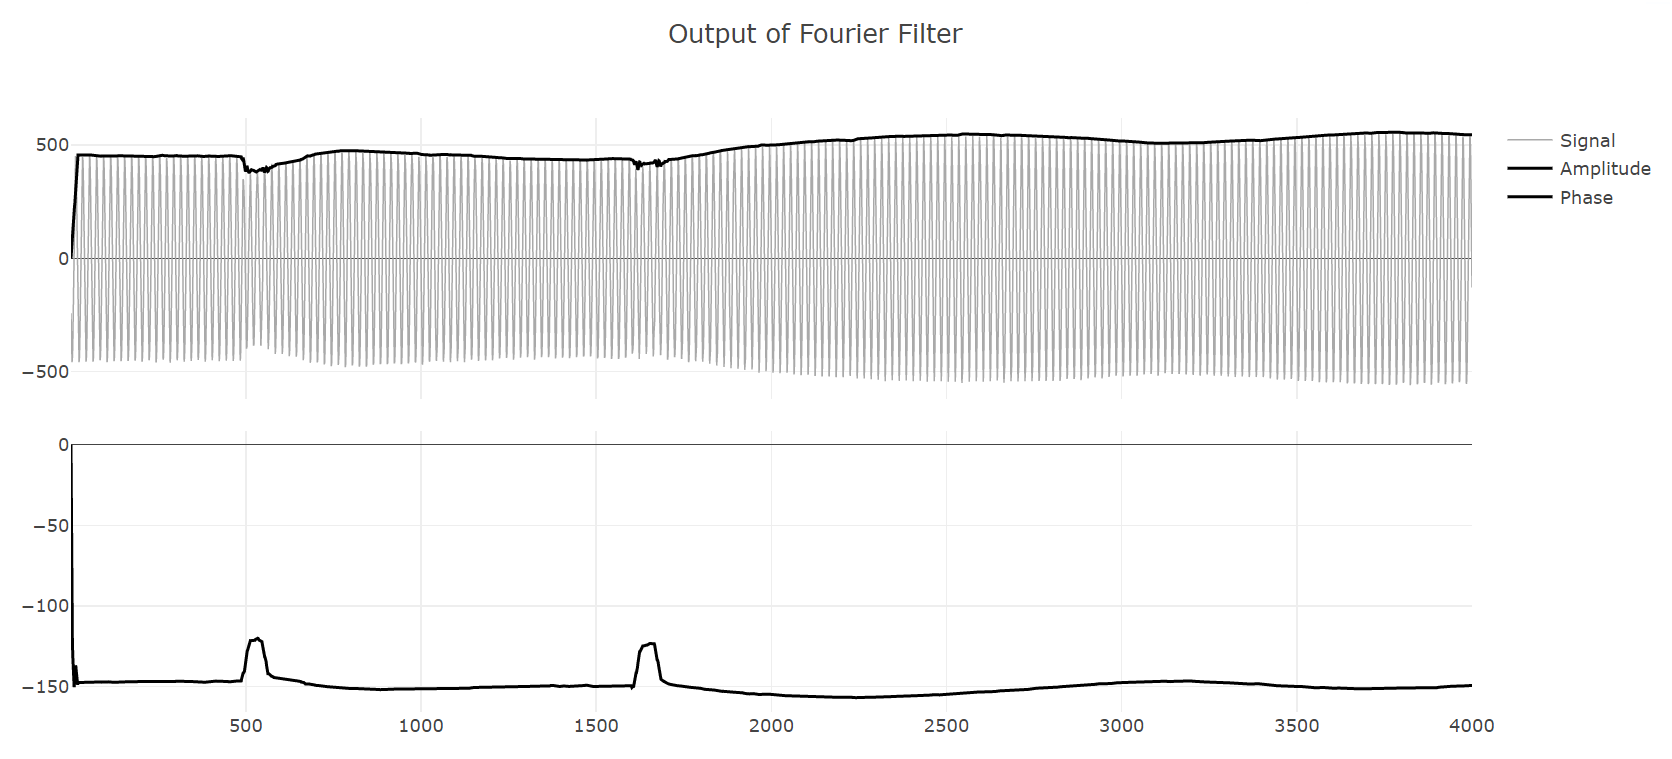
Fig. 7. The results obtained after filtering the Fourier signal from the oscillogram
Analysis tools
For each chart, analysis tools are available: increase / decrease the chart, display instantaneous values, move around the chart. The results can be exported to a picture in png format.