To analyze the spectrum of an arbitrary signal from the waveform, you need to load 2 waveform files with the extension *.CFG and *.DAT, recorded in the COMTRADE 1991 or COMTRADE 1999 format, and click the “Next” button.
Then you need to select the required signal from the list generated automatically by the program from the CFG file, and set the signal interval from the waveform for which it is necessary to build the spectrum. By default, the program sets the range from the beginning to the end of the waveform. The signal sampling rate will be determined automatically from the waveform files (Fig. 1). Click the “Calculate” button.
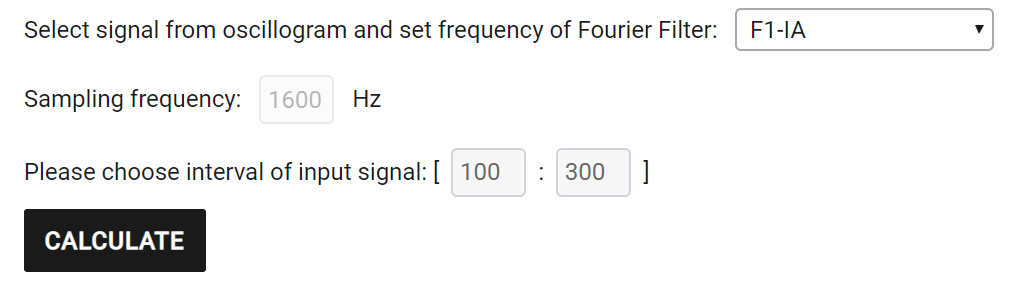
Fig. 1. Signal selection from the oscillogram
2 graphs will be displayed. The signal in question will be displayed on the upper graph (Fig. 2). The lower graph will display the amplitude spectrum of the input signal (Fig. 3). The spectrum is built up to the Nyquist frequency equal to half the sampling frequency of the observed signal.
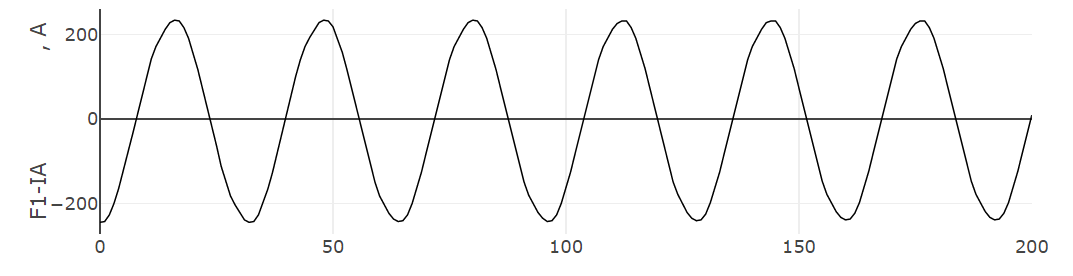
Fig. 2. The input signal from the oscillogram
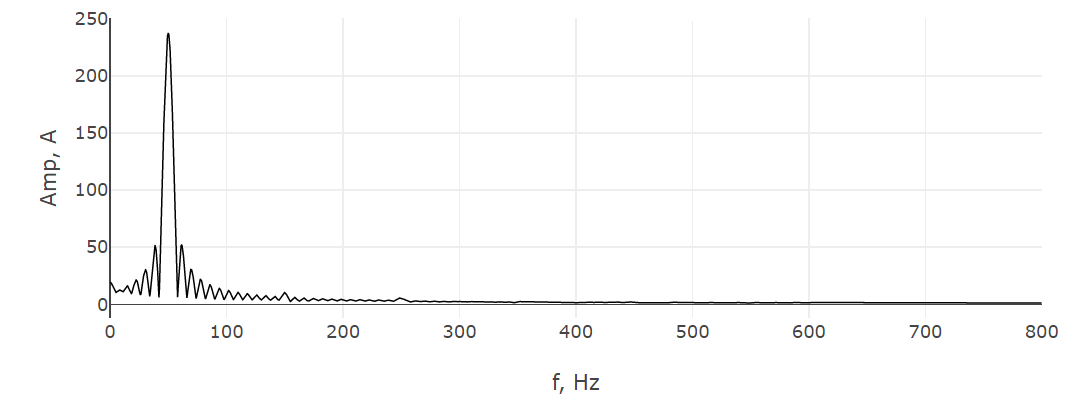
Fig. 3. The amplitude spectrum of the signal
If it is necessary to expand or narrow the interval of the signal under consideration, set the required interval and press the “Calculate” button again. The spectrum of the changed signal will be rebuilt.
Analysis tools
For each chart, analysis tools are available: increase / decrease the chart, display instantaneous values, move around the chart. The results can be exported to a picture in png format.