- Download Oscillogram Files
- Display Signals from Oscillogram Files
- Signal value display
- Toolbar
- Vector diagram
- Frequency spectrum
- Symmetrical components
- Frequency calculation
- Calculated signals
- Settings
- Supported Formats
- Attention!
Download Oscillogram Files
To view the oscillogram load its files in *.CFG and *.DAT format by pressing ![]() button. The file names must be the same before the extension. After loading the Oscillogram files, the Oscillogram displays. If the oscillogram cannot be read, the browser will issue a notification.
button. The file names must be the same before the extension. After loading the Oscillogram files, the Oscillogram displays. If the oscillogram cannot be read, the browser will issue a notification.
Display Signals from Oscillogram Files
The oscillogram viewer displays all the analog (Fig. 1) and discrete signals (Fig. 2) from the oscillogram files. By default, the program displays only those discrete signals that change their state.
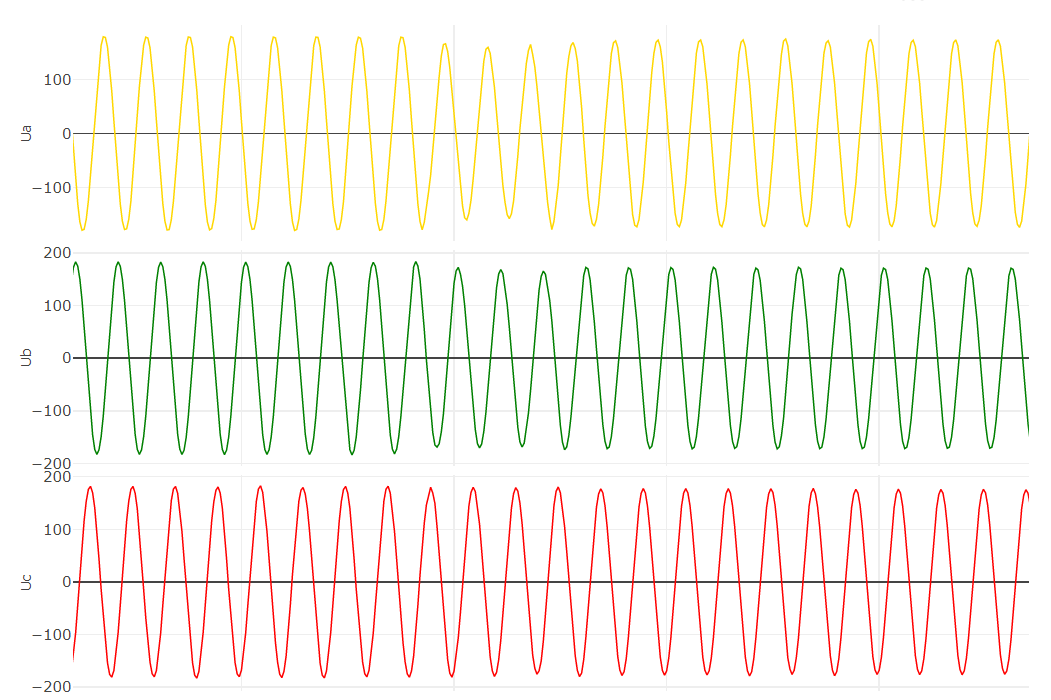
Fig 1. Display of analog signals from the oscillogram
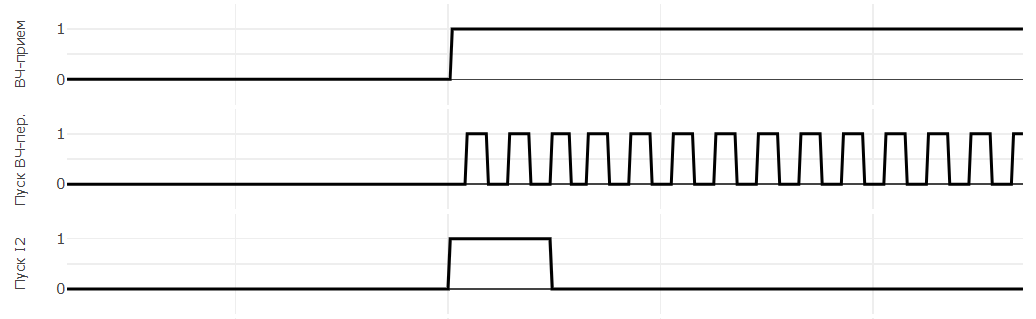
Fig. 2. Display of discrete signals from the oscillogram
For the oscillogram, scaling and viewing values at a specific point when hovering over points on the graph is available, as well as calculating vector values at a specific point selected by the ruler. To move the ruler along the waveform, you must left-click on the desired point.
You can use the left mouse button to scale the waveform. Make sure that at the moment of scaling the button ![]() on the toolbar is in the active state (the button is shaded). If you want to move the waveform around the screen, press the button
on the toolbar is in the active state (the button is shaded). If you want to move the waveform around the screen, press the button ![]() . To move the waveform, hold down the left mouse button.
. To move the waveform, hold down the left mouse button.
To restore the waveform to its original state, you must click the button ![]() available on the toolbar.
available on the toolbar.
Signal value display
In order to determine the actual value of the signal at a certain point in time, you must move the mouse cursor to the desired point and press the left mouse button. After that, a vertical line (ruler) will be displayed on the screen, and measurements of analog and discrete signals will appear on the left. For analog periodic signals, the complex effective value is determined, which is determined using the Fourier filter on an interval of one period of the network frequency. For non-periodic analog signals and digital signals, an instantaneous value is displayed.
Toolbar
Users have access to a toolbar with several buttons:
 : moving to the main page of the site;
 : open oscillogram file;
 : export data to CSV;
 : display of analog channels in primary values;
 : display of analog channels in secondary values;
 : display only changing discrete signals;
 : display of vector diagram;
 : display of frequency spectrum;
 : calculation of symmetrical components;
 : calculation of frequency;
 : calculation signals;
 : zoom;
 : pan;
 : reset axes;
 : settings;
 : help.
The buttons in the active position are highlighted.
The ability to display analog values in secondary quantities is not available for oscillograms in format COMTRADE 1991.
Vector diagram
When a button ![]() is pressed a vector diagram of the analog channels from the oscillogram is displayed on the right side of screen. When you click again, the vector diagram is hidden. Vector measurements of analog channels are displayed in the quantities in which they are presented in the waveform.
is pressed a vector diagram of the analog channels from the oscillogram is displayed on the right side of screen. When you click again, the vector diagram is hidden. Vector measurements of analog channels are displayed in the quantities in which they are presented in the waveform.
By default, a vector diagram is built only for the first 3 analog channels (Fig. 3).
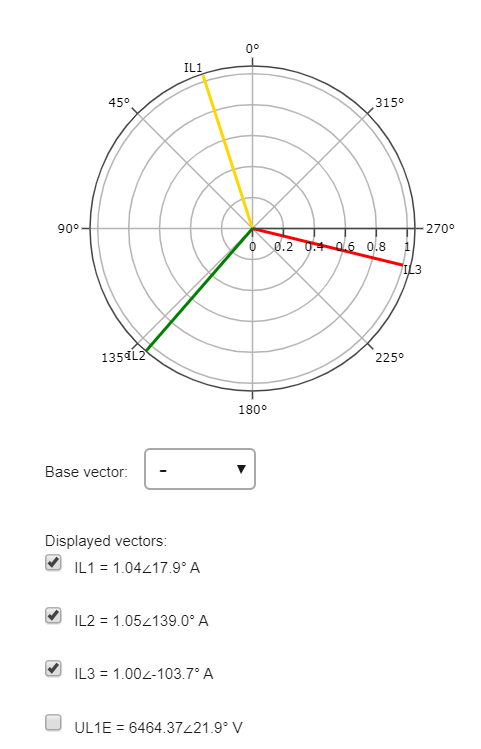
Fig. 3. The appearance of the vector diagram
If necessary, on the vector diagram, you can put all the other necessary analog channels. To do this, set the checkbox to the left of the required vector (Fig. 3). If some vectors need to be removed from the vector diagram, then in this case the checkbox must be removed.
The basic vector selection functionality is also available. When choosing a vector as a base one, its angle is taken equal to 0°, and all other vectors are drawn relative to it.
When the ruler moves along the waveform and when the display of analog values (in primary or secondary) changes, the vector diagram is redrawn for new values.
The vector diagram displays only vector measurements of periodic signals.
Frequency spectrum
When the button ![]() is pressed, the waveform is hidden, and the form for selecting the analog signal for which it is necessary to construct the frequency spectrum is displayed on the screen (Fig. 4). The remaining buttons, except for the graph scaling buttons, become inactive. When you press the button
is pressed, the waveform is hidden, and the form for selecting the analog signal for which it is necessary to construct the frequency spectrum is displayed on the screen (Fig. 4). The remaining buttons, except for the graph scaling buttons, become inactive. When you press the button ![]() again, the screen for constructing the spectrum of the analog signal is hidden, and the waveform is displayed in the form in which it was before pressing this button.
again, the screen for constructing the spectrum of the analog signal is hidden, and the waveform is displayed in the form in which it was before pressing this button.
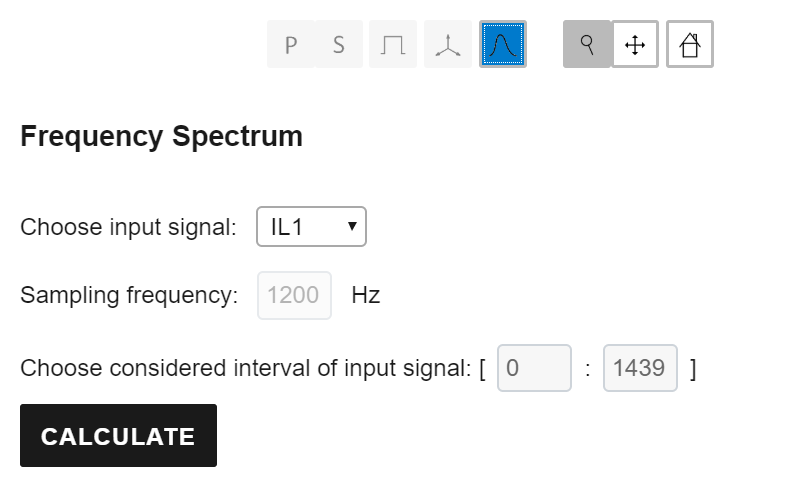
Fig. 4. The program interface for constructing the frequency spectrum of an analog signal
To build the frequency spectrum, it is necessary to select a signal from the list generated automatically by the program from the CFG file and specify the signal interval from the waveform for which it is necessary to construct the spectrum. By default, the program sets the range from the beginning to the end of the waveform. The sample rate of the signal will be determined automatically. To start the calculation, click the “Calculate” button.
2 graphs will be displayed on the screen (Fig. 5). The signal in question will be displayed on the upper graph. The lower graph will display the amplitude spectrum of the signal in question. The spectrum is built up to the Nyquist frequency equal to half the sampling frequency of the observed signal.
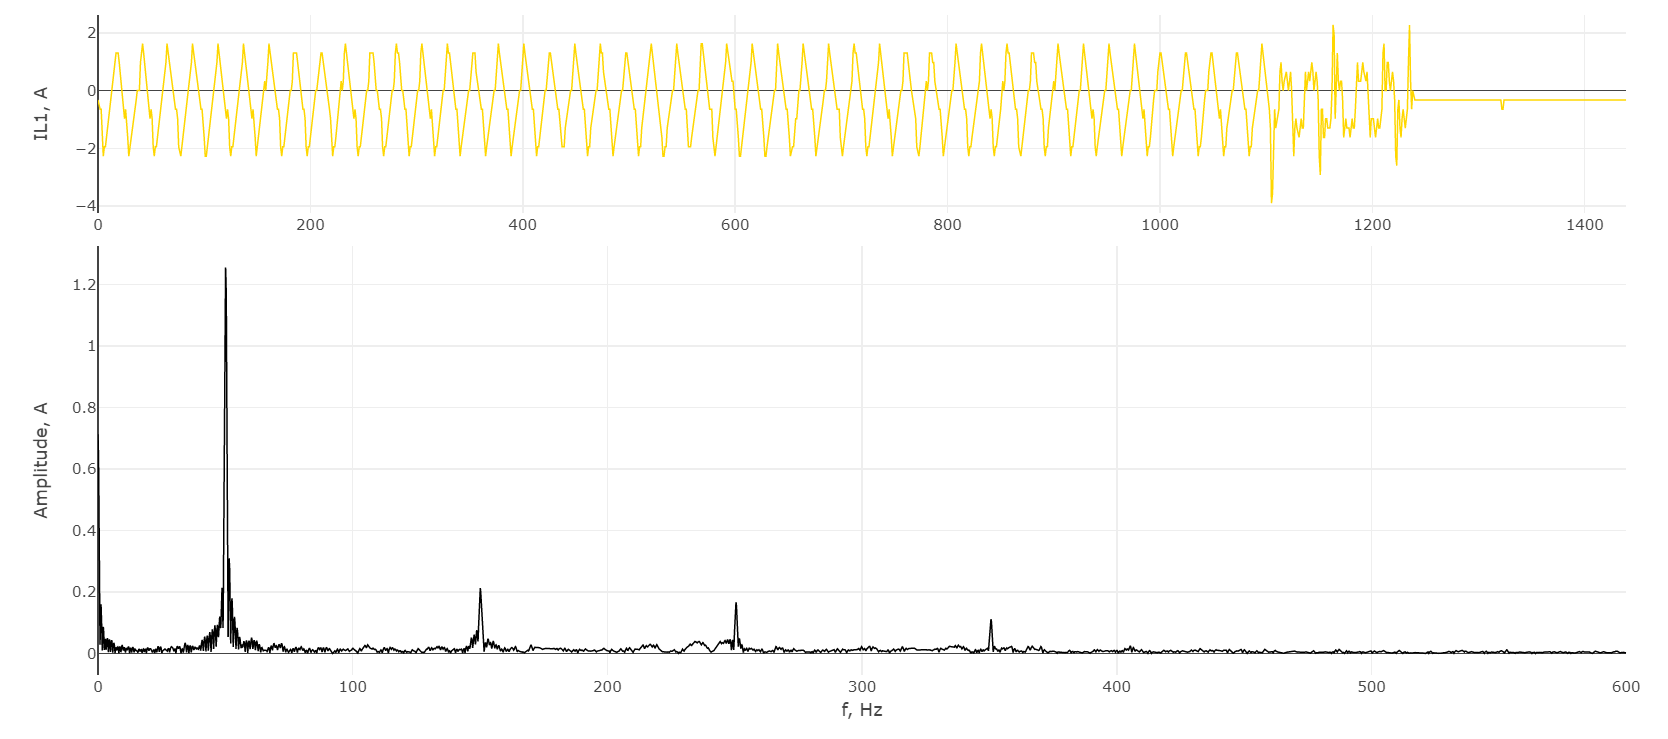
Fig. 5. The signal under consideration and the amplitude spectrum obtained
If it is necessary to expand or narrow the interval of the signal under consideration, set the required interval and press the “Calculate” button again. The frequency spectrum of the signal will be rebuilt.
To exit the signal spectrum calculation function, press the button ![]() again.
again.
Symmetrical components
When button ![]() clicked, the waveform is hidden, and the form for selecting analog signals for calculating the symmetrical components is displayed on the screen (Fig. 6). The remaining buttons, except for the graph scaling buttons, become inactive. When the button
clicked, the waveform is hidden, and the form for selecting analog signals for calculating the symmetrical components is displayed on the screen (Fig. 6). The remaining buttons, except for the graph scaling buttons, become inactive. When the button ![]() is pressed again, the screen for calculating the symmetrical components is hidden, and the waveform is displayed in the form in which it was before the button was pressed.
is pressed again, the screen for calculating the symmetrical components is hidden, and the waveform is displayed in the form in which it was before the button was pressed.
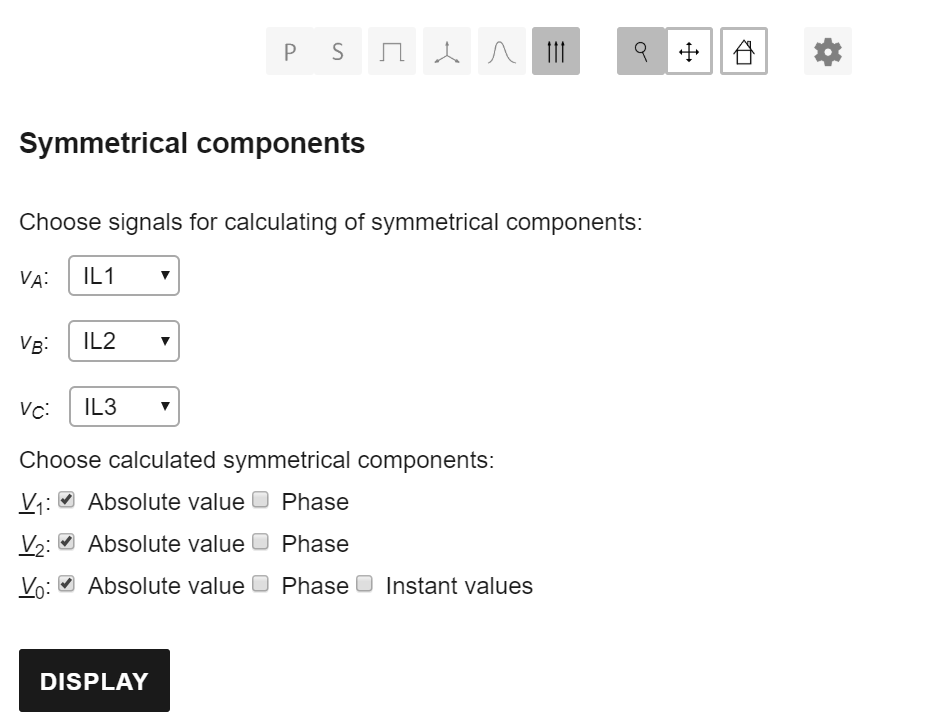
Fig. 6. The program interface for calculating symmetrical components
For the calculation, it is necessary to select the signals from the list generated automatically by the program from the CFG file, and also indicate the necessary calculated symmetrical components. Modules and phases are available for calculation in the positive, negative and zero sequences, as well as instantaneous values of the zero sequence value. To display the calculated signals of the symmetrical components on the screen, you must click the “Display” button.
After pressing the button, the initial waveform will be displayed on the screen, in which the calculated signals of the symmetrical components will be added to the end (Fig. 7). For oscillograms with information on primary and secondary values, the display of the calculated signals of the symmetric components in primary and secondary values is available.
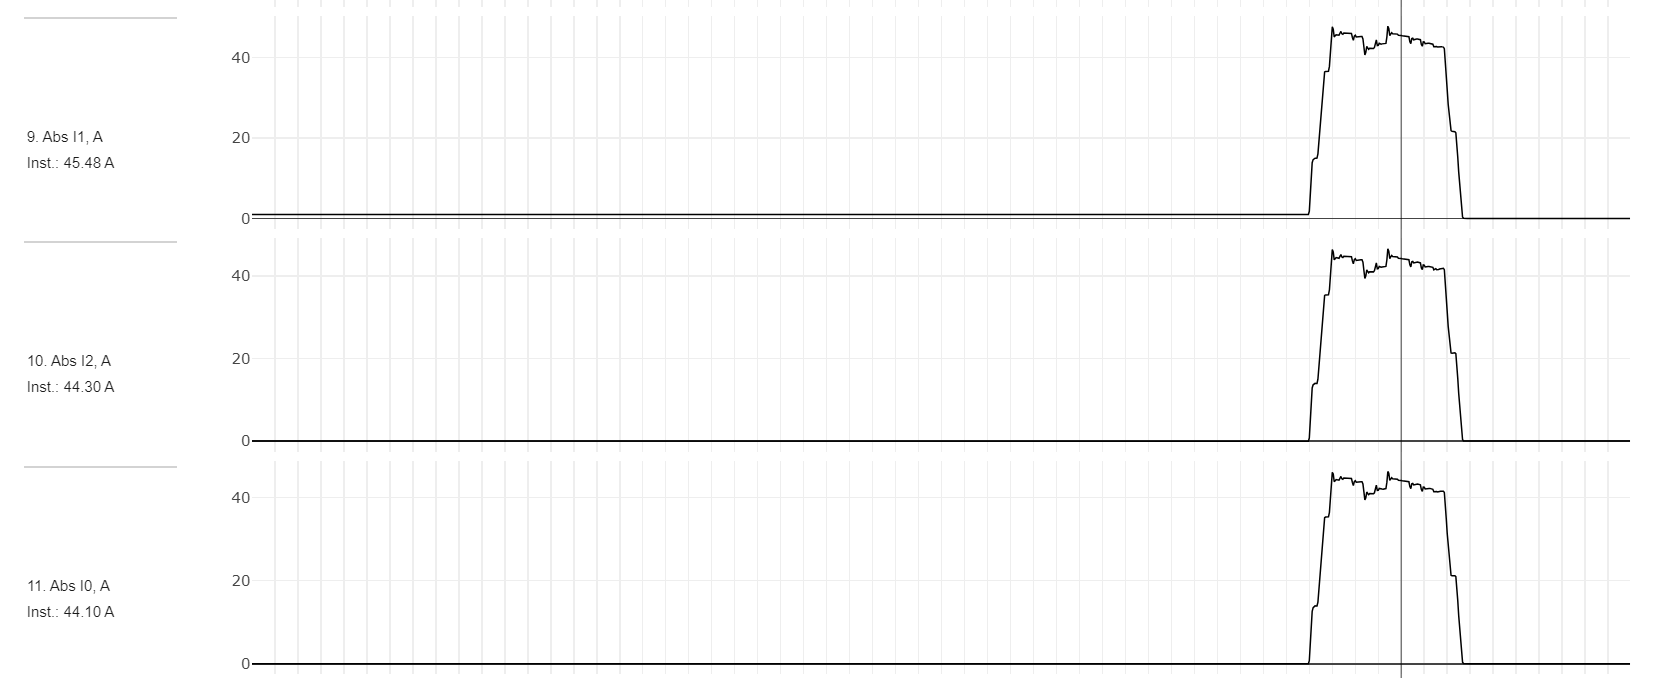
Fig. 7. The calculated signals of the symmetrical components
Frequency calculation
When button ![]() clicked, the oscillogram is hidden, and the screen displays a form for selecting an analog signal for which it is necessary to calculate the frequency (Fig. 8). The remaining buttons, except for the graph scaling buttons, become inactive. When the button
clicked, the oscillogram is hidden, and the screen displays a form for selecting an analog signal for which it is necessary to calculate the frequency (Fig. 8). The remaining buttons, except for the graph scaling buttons, become inactive. When the button ![]() is pressed again, the screen for calculating the frequency is hidden, and the waveform is displayed in the form in which it was before pressing this button.
is pressed again, the screen for calculating the frequency is hidden, and the waveform is displayed in the form in which it was before pressing this button.
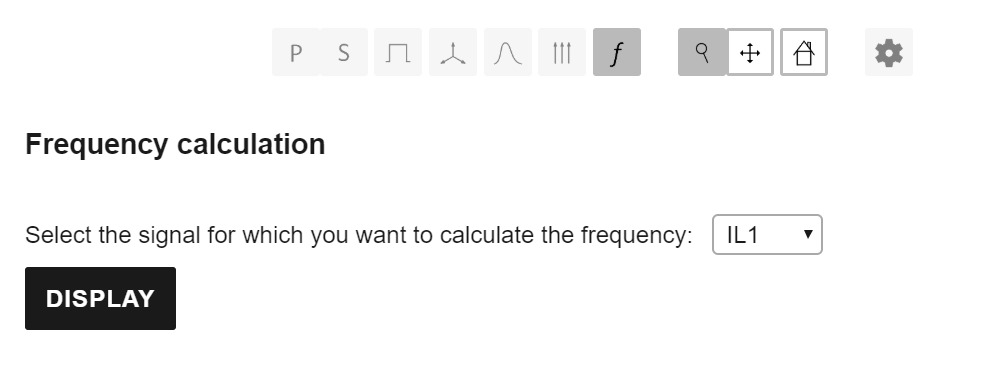
Fig. 8. The program interface for calculating the signal frequency
For calculation, it is necessary to select a signal from the list generated automatically by the program from the CFG file. Frequency is calculated by crossing through zero. To display the calculated frequency signal on the screen, you must click the “Display” button.
After pressing the button, the initial waveform will be displayed on which the calculated frequency signal will be added to the end (Fig. 9).
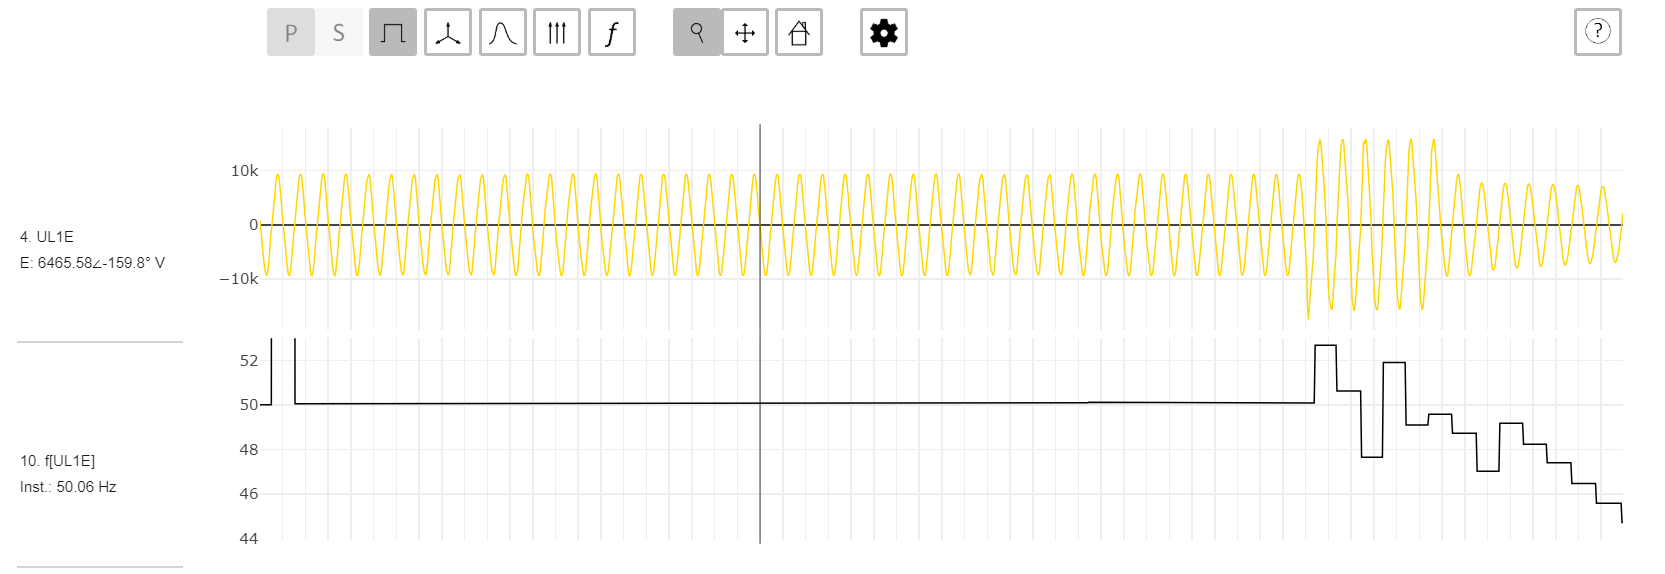
Fig. 9. The calculated frequency signal
Calculated signals
When the button ![]() is pressed, the waveform is hidden, and the form for selecting the calculated expression is displayed on the screen. When the button
is pressed, the waveform is hidden, and the form for selecting the calculated expression is displayed on the screen. When the button ![]() is pressed again, the screen of the calculated signals disappears and the waveform is displayed in the form in which it was before the button was pressed.
is pressed again, the screen of the calculated signals disappears and the waveform is displayed in the form in which it was before the button was pressed.
The program generates the following calculated signals:
- The sum of two signals
- Difference of two signals
- Multiplication by coefficient
For the final calculated signal, instantaneous values can be displayed, as well as the module and phase obtained as a result of processing the obtained instantaneous signal using the Fourier filter. The module and phase are available only for periodic signals.
Settings
The following options are available in the Settings section.
Visibility
Allows you to configure the on-screen analog and discrete waveform signals. The selection of the necessary signals is carried out by setting the appropriate checkbox. When setting the “Select All” checkbox, all checkboxes of analog or discrete signals are set or removed.
Supported Formats
Currently, the oscillogram viewer supports oscillogram recorded in the COMTRADE 1991, COMTRADE 1999 format (BINARY and ASCII) and COMTRADE 2013 (ASCII).
Attention!
If the viewer does not open your oscillogram files, please inform us by e-mail support@faultan.ru with attaching the oscillogram files, and we are try to help you.